OCHA is the part of the United Nations Secretariat responsible for bringing together humanitarian actors to ensure a coherent response to emergencies. OCHA also ensures there is a framework within which each actor can contribute to the overall response effort. http://www.unocha.org/
UNOCHA
Erbil, Iraq
01, Nov 2017
Humanitarian reports often deal with complex issues and vast amounts of data. Infographics and illustrations created using Adobe Illustrator can be powerful tools to transform this information into easily digestible and impactful narratives.
Use visuals to complement your written report, creating a cohesive narrative that tugs at heartstrings and inspires action.
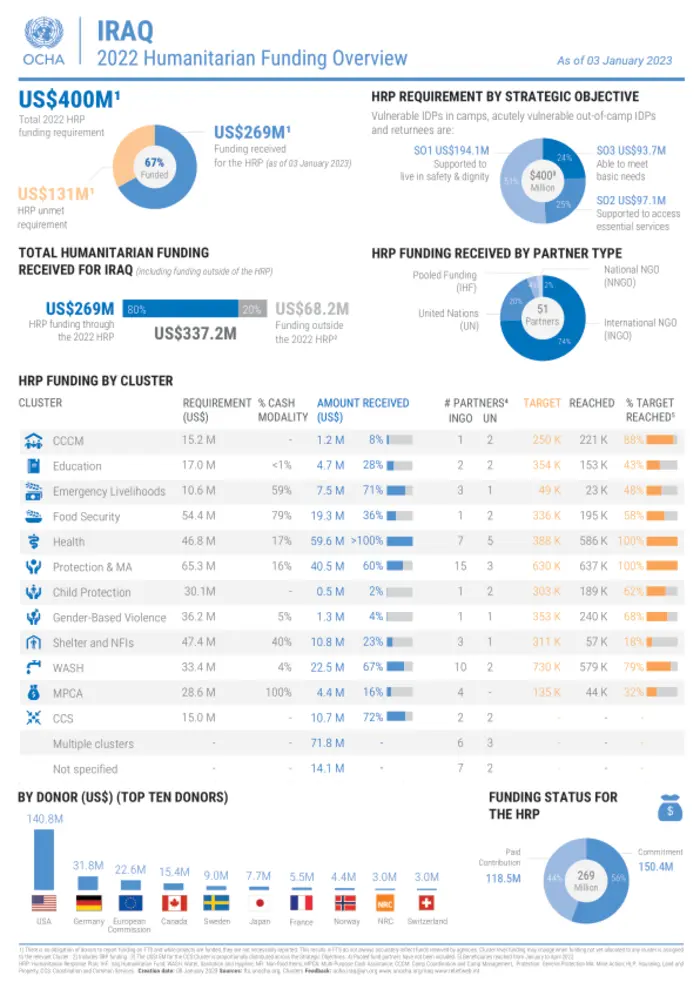
Integrated with Excel and Adobe Illustrator to created visually appealing charts and easy to understand.
Built a robust and easy-to-use document using adobe creative cloud to update and create different language variation including but not limited to: English, Kurdish and Arabic
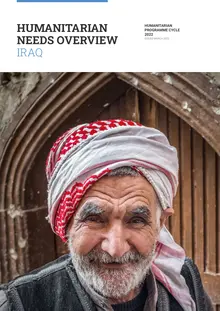
The 2022 Iraq HNO focuses on the humanitarian needs of the people displaced by the 2014-2017 ISIL attacks and subsequent military operations to defeat them. The analysis covers all districts in Iraq that were either directly impacted by the crisis or which host IDPs and returnees, namely in the governorates of Al-Anbar, Baghdad, Diyala, Duhok, Erbil, Kirkuk, Ninewa, Salah Al-Din and Al-Sulaymaniyah.
Use visuals to complement your written report, creating a cohesive narrative that tugs at heartstrings and inspires action.
Integrated with Excel, Adobe Illustrator & Adobe Indesign to created visually appealing charts and easy to understand.
Built a robust and easy-to-use document using adobe creative cloud to update and create different language variation including but not limited to: English, Kurdish and Arabic
Five years after a large-scale military operation against the Islamic State of Iraq and the Levant (ISIL), the humanitarian situation in Iraq has improved considerably. The number of people who require humanitarian assistance, because of this conflict, had declined from 11 million people in 2017 to 2.5 million in 2022. These included 1.7 million returnees, 180,000 internally displaced people living in camps and 550,000 people living outside camps.
Use visuals to complement your written report, creating a cohesive narrative that tugs at heartstrings and inspires action.
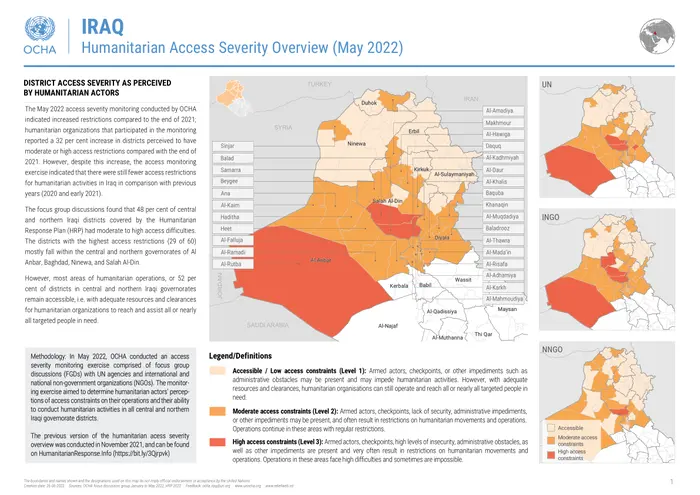
Integrated with Excel, Adobe Illustrator & Adobe Indesign to created visually appealing charts and easy to understand.
Built a robust and easy-to-use document using adobe creative cloud to update and create different language variation including but not limited to: English, Kurdish and Arabic
Humanitarian reports often deal with complex issues and vast amounts of data. Infographics and illustrations created using Adobe Illustrator can be powerful tools to transform this information into easily digestible and impactful narratives.
Use visuals to complement your written report, creating a cohesive narrative that tugs at heartstrings and inspires action.
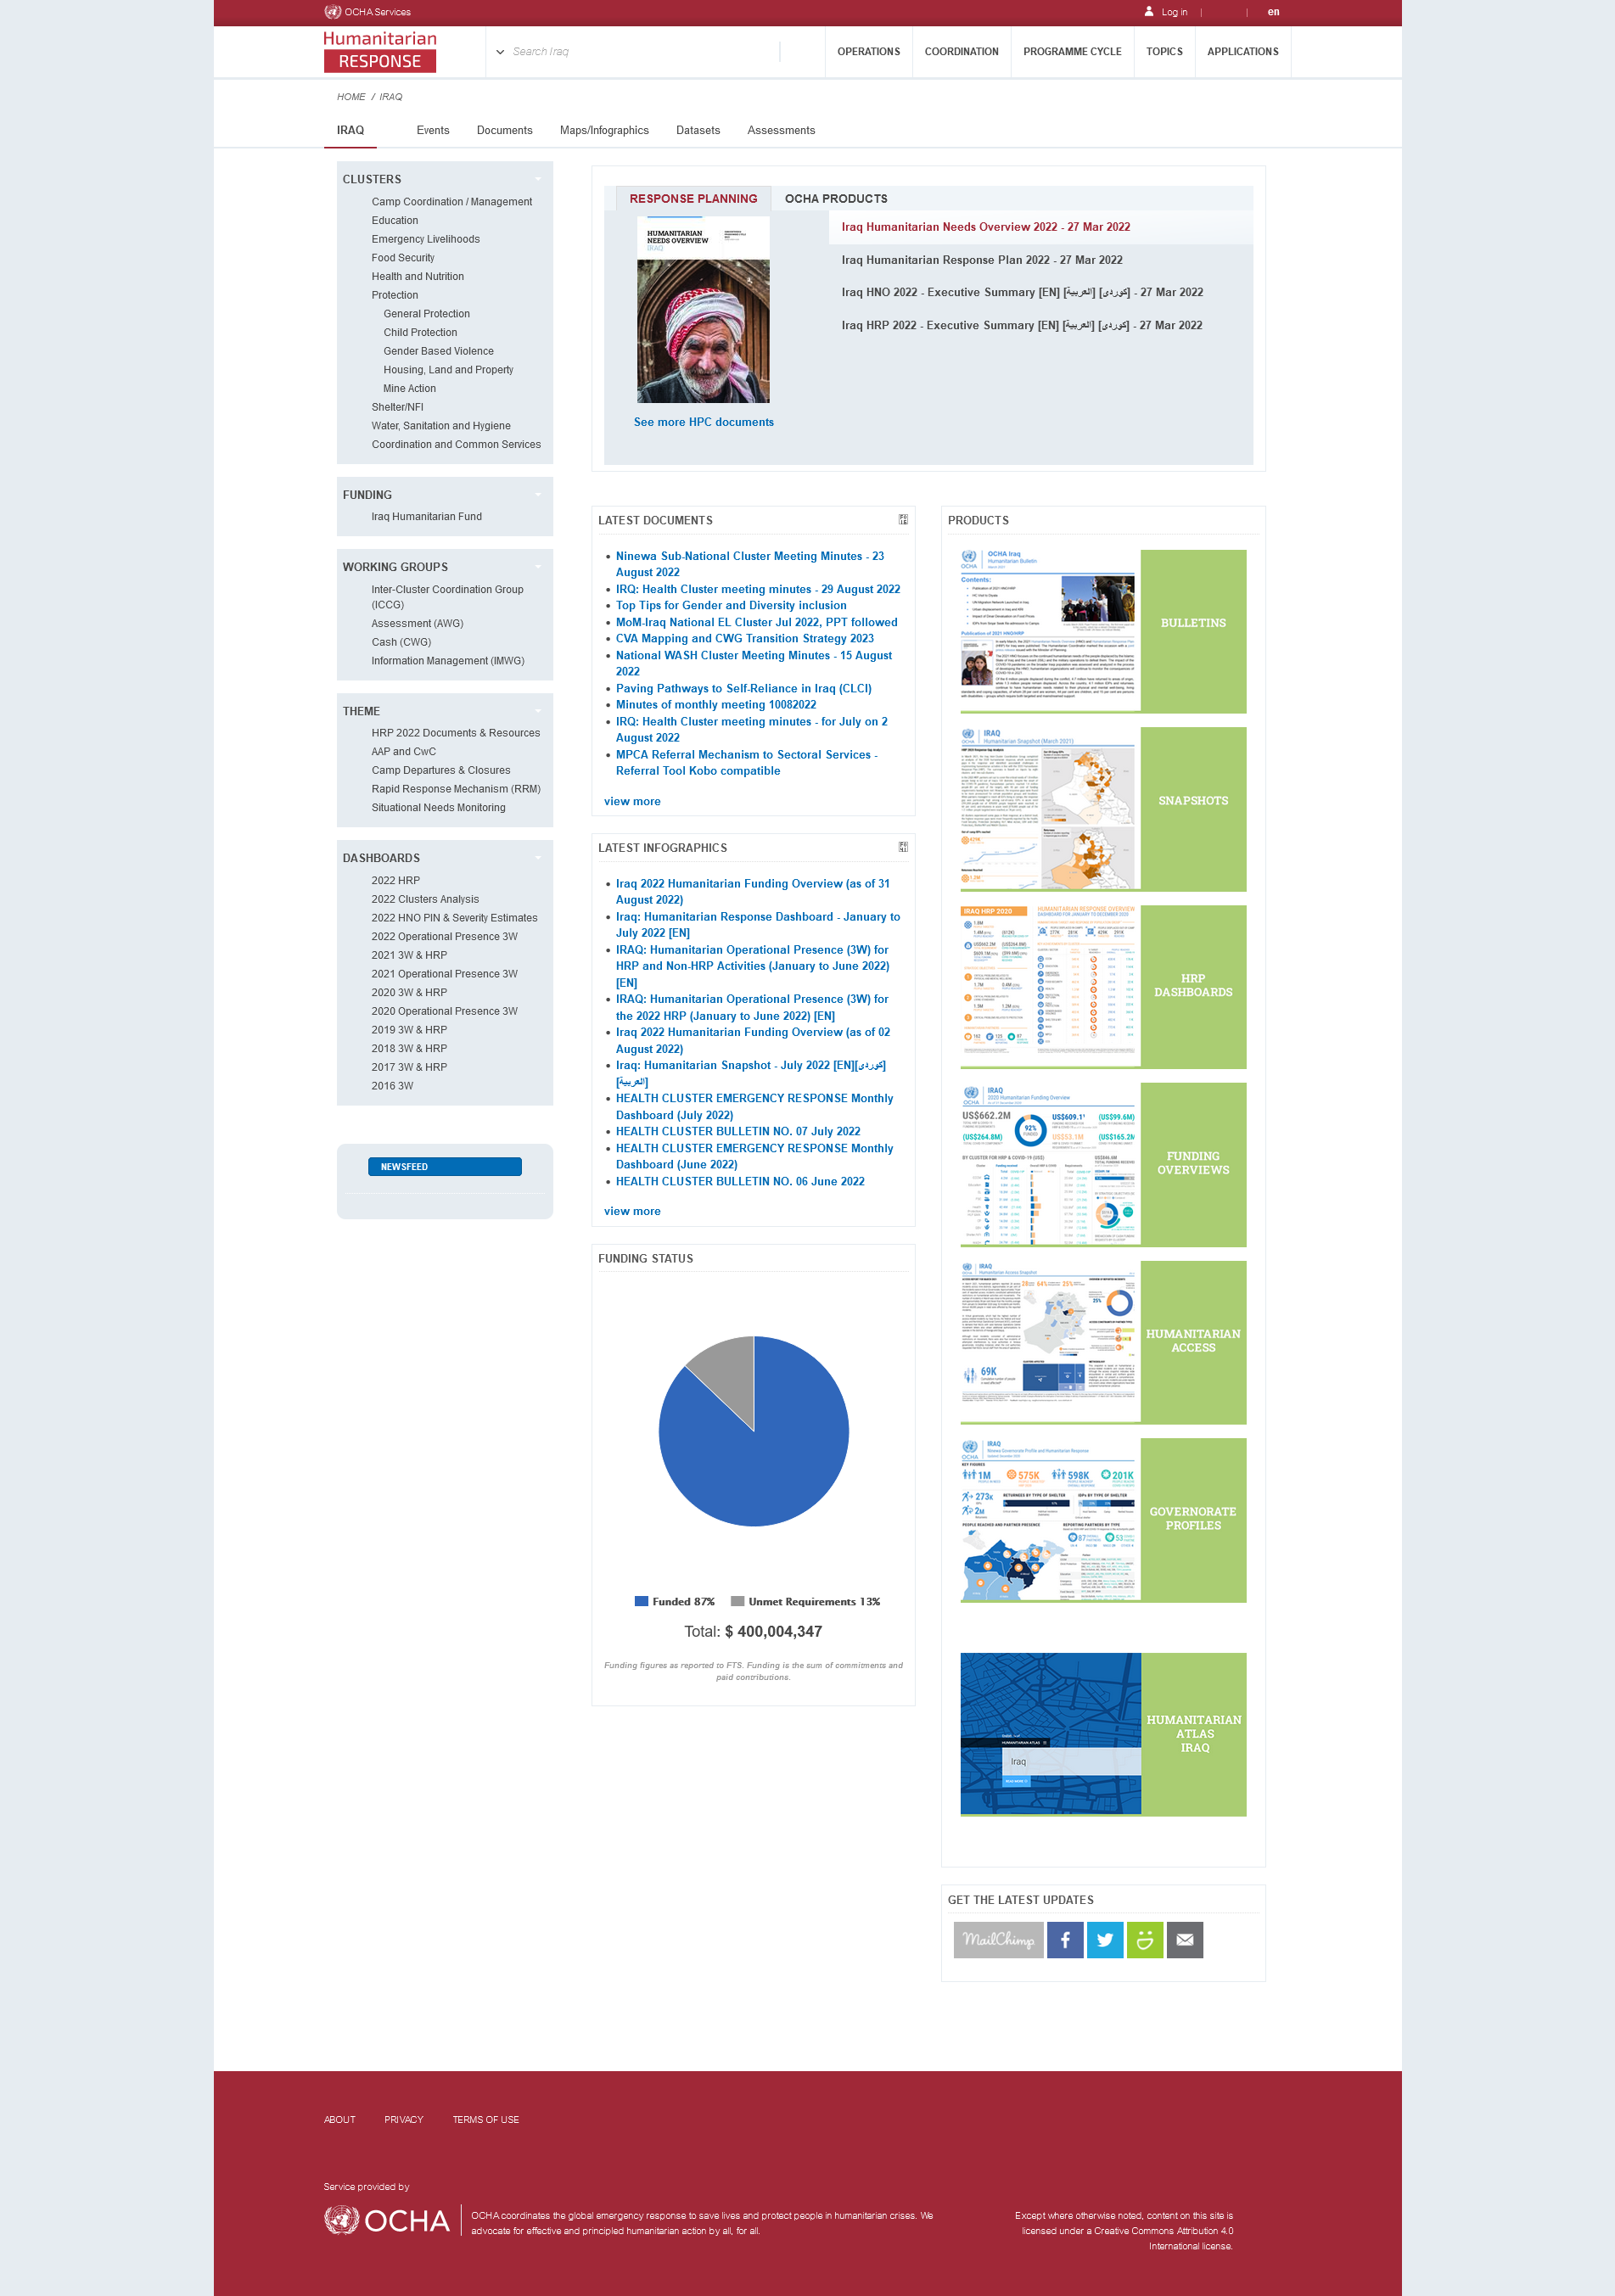
Integrated with Excel, Adobe Illustrator & Adobe Indesign to created visually appealing charts and easy to understand.
Built a robust and easy-to-use document using adobe creative cloud to update and create different language variation including but not limited to: English, Kurdish and Arabic
Sign up for my newsletter to get latest updates. Do not worry, we will never spam you.